|
|
|
|
|
|
Ozone Loss:
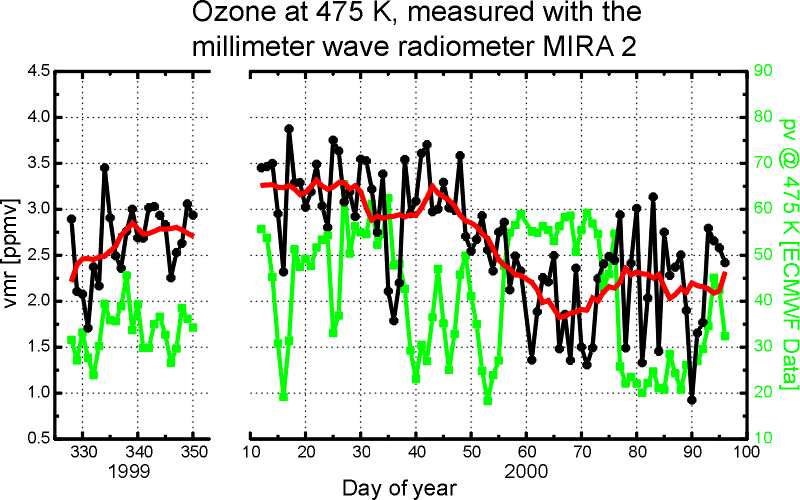
Ozone volume mixing ratio at 475 K level
from December 1999 to April 2000.
The red curve is a 10 day's average, the green curve
is the potential vorticity at 475 K over Kiruna (ECMWF data).
Ozone loss from January to March 2000 due to man-made ozone
depleting substances is approx. 1.2 ppmv or over 40%.
